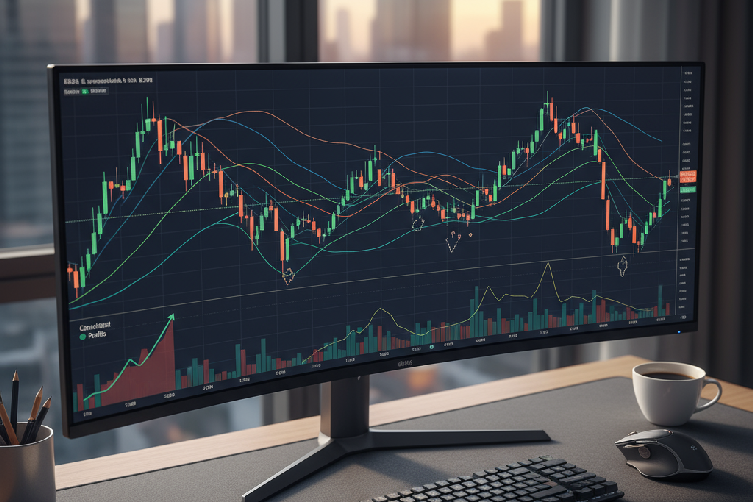
Tag: swing trading

  • Mastering VWAP for Powerful Swing Trading

    Mastering VWAP: 7 Powerful Swing Trading Strategies

    A VWAP swing trading strategy is an approach that leverages the Volume Weighted Average Price (VWAP) to pinpoint buy and sell signals for swing trades. This method melds VWAP analysis with fundamental swing trading principles, helping traders find ideal entry and exit points for positions held over several days or weeks.

    By using a VWAP strategy, you get a volume-adjusted perspective on price action. This can make identifying crucial support and resistance levels much more effective. To use VWAP for swing trading, simply monitor the price in relation to the VWAP line. When the price is above VWAP, it suggests a potential uptrend; when it’s below, it hints at a downtrend.

    This technique helps swing traders ride medium-term market movements by aligning with institutional trading patterns and momentum. Incorporating VWAP into your strategy, especially when working with a reliable online forex broker, can sharpen your decision-making and boost your chances of profitable trades.

    The Foundation of VWAP Swing Trading

    Understanding VWAP Basics

    VWAP serves as a trading benchmark, showing the average price of a security throughout the day, weighted by volume. It gives traders valuable insights into both the trend and the true value of an asset. Unlike simple moving averages, VWAP includes volume data, making it a more robust indicator for analyzing price action.

    The formula for VWAP is:

    VWAP = Cumulative (Price * Volume) / Cumulative Volume

    Key components include:

    • Price Data: Often calculated as (High + Low + Close) / 3.
    • Volume Data: The total number of shares or contracts traded.
    • Time Period: Typically calculated fresh from each market open.
    • Benefits and Misconceptions

      Using VWAP in your trading offers several advantages:

    • It provides a more accurate picture of actual trading activity.
    • It helps identify potential support and resistance levels.
    • It offers clues into institutional trading behavior.
    • It reduces the impact of potential price manipulation.
    • It’s also important to clear up some common misconceptions about VWAP:

    • VWAP isn’t a lagging indicator in the same way moving averages are.
    • Its use isn’t limited to day trading; it’s highly applicable to swing trading.
    • VWAP doesn’t predict future prices but instead reveals the current value.
    • The Significance of Volume in VWAP

      Volume is critical for validating price movements and confirming trends. By incorporating volume, VWAP gives you a clearer view of the market.

      Volume analysis techniques you can use with VWAP include:

    • Volume Profile Integration: Identifying high-volume price levels to spot potential breakout or support/resistance zones.
    • Volume Spread Analysis: Analyzing how volume is spread across price levels to detect potential reversals and institutional footprints.
    • Relative Volume Analysis: Comparing current volume to historical averages to confirm trend strength or spot unusual activity.
    • Illustration about Mastering VWAP: 7 Powerful Swing Trading Strategies Introduction A VWAP swing trading strategy is a  for traders

      Historical Context of VWAP Trading

      VWAP was originally created for institutional traders to help them evaluate their trade execution quality, minimize market impact, and benchmark performance against the average market price. It has evolved significantly over the decades.

    • 1980s: VWAP is first developed for institutional use.
    • 1990s: It becomes integrated into electronic trading systems.
    • 2000s: Retail traders begin to adopt VWAP into their strategies.
    • 2010s & Present: Advanced algorithms, AI, and machine learning now use VWAP for sophisticated trading strategies.
    • Top VWAP Swing Trading Strategies

      1. VWAP Crossover Strategy

      The VWAP crossover is one of the most direct and effective VWAP strategies. When the price crosses above or below the VWAP line, it generates a potential signal to enter a trade, making it a popular way to capitalize on trend reversals and continuations.

      Here are the key points:

    • Buy Signal: The price crosses decisively above the VWAP line, signaling potential bullish momentum.
    • Sell Signal: The price crosses firmly below the VWAP line, indicating a potential bearish trend.
    • Confirmation: Use other indicators like RSI or MACD to confirm your entry and exit signals for greater confidence.

    Implementation Guidelines

    To execute this strategy effectively, follow these steps:

  • Identify the Trend: Start by looking at a higher timeframe VWAP to grasp the overall market direction. You want to see clear price action above or below the VWAP to understand the dominant trend.
  • Wait for a Pullback: After a strong move, allow the price to pull back toward the VWAP line. Look for consolidation or price rejection near the VWAP, as this often precedes the next market move.
  • Confirm the Crossover: Wait for a decisive break of the VWAP line, supported by strong volume. A spike in volume during the crossover adds conviction to the signal.
  • For entries, you can use a market order right at the crossover for quicker execution or a limit order just beyond the line to reduce slippage. Furthermore, scaling into a position across multiple price points can help you manage risk and improve your average entry price.

    By mastering this foundational strategy, you can build a solid framework for using VWAP in your swing trading, helping you make more informed and strategic decisions in the market.

  • Master Weekly Swing Trading: 7 Proven Strategies

    Master Weekly Swing Trading: 7 Proven Strategies

    Master Weekly Swing Trading: 7 Proven Strategies

    Master Weekly Swing Trading: 7 Proven Strategies - Trading Insights

    A weekly swing trading strategy is a systematic way to trade that focuses on holding positions for several days or weeks. The goal is to capture those medium-term price movements and capitalize on the market’s natural ups and downs.

    This approach can often lead to higher returns with much less stress compared to day trading. With a minimal time commitment of just 1-2 hours of analysis daily, swing trading lets you make well-informed decisions without being glued to your screen.

    This article breaks down seven highly effective weekly swing trading strategies designed to boost your profitability while helping you maintain a healthy work-life balance. Whether you’re a beginner or an experienced trader, this guide offers actionable steps for finding profitable market opportunities.

    Understanding Weekly Swing Trading

    A weekly swing trading strategy is a powerful method for capturing medium-term price movements. Traders hold positions for several days, or even a few weeks, depending on the market’s conditions and current trends.

    The main objective is to identify and profit from price “swings” within a larger trend—up or down—before the market decides to change direction.

    What Makes Weekly Swing Trading Different?

    This strategy is distinct from other trading styles like fast-paced day trading or long-term investing. Day trading demands constant market monitoring and split-second decisions, which can be stressful and all-consuming.

    In contrast, a weekly swing trading strategy offers a more relaxed and flexible approach. Holding positions over several days gives you more time to analyze price movements deliberately. You don’t need to watch every tick; checking in a few times a week is often enough, making it ideal for balancing trading with a busy life.

    Illustration about Master Weekly Swing Trading: 7 Proven Strategies for 30% More Profitable Trades Introduction A weekl for traders

    Key Benefits of Weekly Swing Trading

    Adopting a weekly swing trading strategy comes with several powerful advantages:

    • Reduced Time Commitment: Spend significantly less time watching charts. Swing traders typically need 60-70% less time for market analysis compared to day traders, freeing you up for other responsibilities.
    • Lower Stress Levels: With fewer trades executed each week, you can avoid the emotional fatigue and stress that comes with the rapid-fire decisions required in day trading.
    • Cost-Effective Trading: Fewer trades mean lower commission costs and transaction fees. This makes swing trading a more economical choice, helping you keep more of your profits.
    • Better Work-Life Balance: One of the biggest draws is the freedom from constant screen time. You can pursue a career, hobbies, or family time without being chained to your trading desk.
    • Enhanced Analysis Quality: More time between trades allows for deeper, more thorough analysis of market conditions, price patterns, and technical indicators, leading to smarter decisions.
    • Improved Risk Management: This strategy provides ample time to plan your entries and exits carefully. You can set well-thought-out stop-loss and take-profit levels to manage risk effectively.
    • Essential Weekly Swing Trading Strategies

      Here are some proven strategies to get you started.

      1. The Trend-Following Strategy

      The trend-following strategy is a classic for a reason, showing a success rate of up to 65% when executed correctly. The idea is to trade in the same direction as the primary market trend.

      Implementation Steps:

    • Identify the Primary Trend: Use weekly charts to see the market’s overall direction. Applying 20-week and 50-week moving averages can help confirm the trend. Look for a clear pattern of higher highs and higher lows for an uptrend, or lower lows and lower highs for a downtrend.
    • Find Your Entry Points: Once you’ve identified the trend, wait for a pullback. Look to enter during pullbacks to key support levels in an uptrend, or at resistance levels in a downtrend. This allows you to enter at a more favorable price before the trend continues.
  • Best Candlestick Patterns for Swing Trading

    Best Candlestick Patterns for Swing Trading

    Best Candlestick Patterns for Swing Trading

    Best Candlestick Patterns for Swing Trading - Trading Insights

    Ever feel lost trying to find those perfect entry and exit points in swing trading? It’s a super common challenge. Missing that sweet spot or jumping into a trade too late can really eat into your potential profits and make you doubt yourself. Simply going with your gut or getting bogged down in super complex charts often creates more confusion than clarity.

    What really helps is having a clear, visual way to understand what the market’s doing and where prices might head next. This is exactly why mastering the best candlestick patterns for swing trading is so incredibly useful. These visual setups offer powerful insights, guiding you to make smarter decisions, possibly even with help from a trusted online forex broker. This article will be your go-to guide for the most effective patterns and show you how to use them in your trading.

    What Exactly is Swing Trading?

    Think of swing trading as trying to catch the big ‘waves’ or movements in market prices. It’s a trading style where traders aim to profit from price shifts over a few days to several weeks. Unlike day traders who close all their positions by the end of the day, swing traders hold onto theirs for longer.

    The goal isn’t to capture every tiny price wiggle. Instead, it’s about spotting a likely direction, riding that move for a bit, and then exiting before it’s likely to reverse. This needs careful analysis of price charts, usually on daily or 4-hour timeframes, to pinpoint potential turning points or confirm trend continuations.

    Understanding Candlestick Charts

    Candlestick charts tell a visual story of how prices have moved over time. They first appeared in 18th-century Japanese rice trading and are now essential tools for technical analysts worldwide. Each ‘candlestick’ shows price activity for a specific period (like one day or four hours).

    Let’s break down what makes up a candlestick:

    • The Real Body: This wider part shows the range between the opening and closing prices. Generally, a green (or white) body means the price closed higher than it opened, which is good for buyers. A red (or black) body means it closed lower, favoring sellers.
    • The Wicks (Shadows): These are the thin lines extending above and below the real body. The upper wick shows the highest price reached, while the lower wick indicates the lowest price during that period. The shape and color of the candle immediately tell you who was winning the fight between buyers (bulls) and sellers (bears) during that time.
    • Illustration about Best Candlestick Patterns for Swing Trading Feeling a bit adrift when trying to pinpoint solid entry for traders

      Why Candlesticks Are a Must for Swing Traders

      If you’re into swing trading, candlestick charts are absolutely indispensable. They give you instant visual feedback on market psychology and potential shifts in momentum that might take longer to spot with other indicators. Here’s why they’re so crucial:

    • Market Sentiment Indicator: The size and color of the candle body, plus the length of the wicks, quickly show whether buyers or sellers were in charge and how much control they had.
    • Spotting Potential Reversals: Certain candlestick patterns can signal that a trend might be losing steam and could reverse. This creates chances to enter new trades or exit existing ones. Looking for the best candlestick patterns for swing trading often begins right here.
    • Confirming Trend Continuation: Other patterns suggest that the current trend is likely to keep going. This gives traders confidence to hold onto a position or even add to it.
    • Pinpointing Entry/Exit Points: Candlestick patterns, especially when they show up at key technical levels (like support or resistance), can offer very precise signals for starting or ending your swing trades. Getting good at reading these visual clues is fundamental for developing effective swing trading candlestick strategies.

    How Candlesticks Signal Swings

    Learning individual patterns is the first step, but their real power in swing trading comes when you look at them within the bigger market picture. Candlesticks do more than just show prices; they illustrate the ongoing battle between buyers and sellers, hinting at potential future moves perfect for catching market swings.

    Identifying Trend Reversals

    One of the most valuable things candlestick analysis offers swing traders is the ability to spot possible trend reversals. After a strong uptrend or downtrend, specific patterns can emerge that signal the current trend is wearing out and a move in the opposite direction might be starting. For example, a candle with a long upper wick after an uptrend could mean sellers are starting to push prices down, suggesting a potential pullback or reversal.

    Quickly recognizing these reversal signals lets swing traders get into a favorable position for the next anticipated swing. This is absolutely key when you’re looking for the best candlestick patterns for swing trading opportunities.

    Using Candlesticks for Continuation

    Candlestick patterns aren’t just for reversals; they also confirm when a trend is likely to continue. Patterns like three white soldiers or three black crows can indicate strong momentum. These patterns provide confidence to ride the existing trend longer, maximizing profits. Combining these signals with other technical analysis tools helps create robust swing trading strategies, ensuring you’re always aligned with the market’s direction.

  • 5 EMA Swing Trading: Path to Consistent Forex Profits

    5 EMA Swing Trading: Path to Consistent Forex Profits

    5 EMA Swing Trading Strategy – The Path to Consistent Profits

    5 EMA Swing Trading: Path to Consistent Forex Profits - Trading Insights

    Navigating the forex market for consistent profits can be a challenge. The 5 EMA swing trading strategy offers a robust technical analysis method for identifying promising trading opportunities.

    This approach uses the 5-period Exponential Moving Average to pinpoint short-term trend changes and momentum shifts. Its simplicity and effectiveness make it a popular choice for traders seeking an effective trading strategy. It helps you make informed decisions about entering and exiting trades, combining the quick responsiveness of the 5-period EMA with price action analysis.

    What Is the 5 EMA Swing Trading Strategy?

    The 5 EMA swing trading strategy is a technical analysis method that leverages the 5-period Exponential Moving Average. Its primary goal is to identify short-term trend reversals and potential trading opportunities within the market.

    This strategy shines for swing traders who aim to capture price movements over several days to weeks. Because the 5 EMA reacts quickly to price changes, it’s an excellent tool for staying ahead of market shifts.

    Mathematical Foundation of the 5 EMA

    The 5 EMA is calculated with a formula that prioritizes recent prices, making it more responsive than simple moving averages. The calculation is:

    `EMA = Price(t) × k + EMA(y) × (1 − k)`

    Where:

    • `t = today`
    • `y = yesterday`
    • `k = 2 ÷ (N + 1)`
    • `N = number of periods (5 in this case)`
    • This mathematical weighting ensures the EMA reflects current market conditions accurately. Let’s break down its components:

    • 5 EMA Line:
    • * Acts as a dynamic support/resistance level, adapting to price changes and offering real-time insights.
      * Helps identify trend direction, guiding traders on whether to take long or short positions based on market momentum.
      * Signals potential entry and exit points, providing clear indicators for action based on price movements relative to the EMA.

    • Price Action:
    • * Candlestick patterns offer confirmation, visualizing market sentiment and potential future movements.
      * Key reversal patterns to observe include:
      * Engulfing patterns: Indicate a strong shift in market sentiment and potential trend reversals.
      * Doji candles: Signify market indecision and potential turning points.
      * Hammer and Shooting Star formations: Highlight potential reversals after a price movement, offering critical insight.

    • Support and Resistance Levels:
    • * Historical price levels show consistent behavior, helping traders anticipate future price movements.
      * Psychological round numbers often act as key barriers for price action, influencing trader decision-making.
      * Previous swing highs and lows provide context for current price levels, aiding in identifying potential breakout or reversal zones.

      Illustration about 5 EMA Swing Trading Strategy – The Path to Consistent Profits Introduction The 5 EMA swing trading s for traders

    • Volume:
    • * Confirms trend strength; higher volume during price movements indicates stronger conviction.
      * Helps identify potential reversals by showing divergences between price and volume, alerting traders to possible market dynamic changes.
      * Validates breakouts, ensuring price movements are supported by sufficient trading activity for sustainability.

      How to Implement the 5 EMA Strategy

      Step 1: Setting Up Your Charts

      First, choose a suitable timeframe for your trading style.

    • H4 (4-hour) benefits:
    • * Less noise than lower timeframes, leading to clearer signals.
      * Suitable for part-time traders, requiring less frequent monitoring.
      * Captures significant moves, offering ample profit opportunities.

    • Daily timeframe advantages:
    • * Reduces false signals, resulting in more reliable trade setups.
      * Better for longer-term trends, aligning with broader market movements.
      * Often aligns with institutional trading, enhancing the likelihood of successful trades.

      Next, add the 5 EMA indicator:

    • Platform-specific instructions (e.g., on the FXNX platform): Navigate to `Insert > Indicators > Trend > Moving Average` or `Indicators > Moving Average` and set it to Exponential with a Period of 5.
    • Finally, identify key support and resistance levels:

    • Use multiple timeframe analysis for a comprehensive view of price action.
    • Mark significant swing highs and lows, which can act as potential reversal points.
    • Note round numbers (e.g., 1.3000, 1.3500) that often serve as psychological barriers.
    • Step 2: Entry Rules

      #### Long Positions

    • Price crosses above the 5 EMA:
    • * Wait for the candle to close above the EMA to confirm the breakout.
      * Look for strong momentum candles, indicating a robust trend.
      * Avoid entering during ranging markets, as they can lead to false signals.

    • Bullish candlestick patterns:
    • * Engulfing patterns success rate: ~70%, indicating strong buying pressure.
      * Hammer formations reliability: ~65%, suggesting potential reversals.
      * Morning Star patterns accuracy: ~75%, providing additional confirmation for long entries.

    • Volume Confirmation:

    * Above-average volume is preferred, as it indicates strong buyer conviction.