Blog

  • Blockchain Explained: Understanding the Impact of Technology

    Blockchain Explained: Understanding the Impact of Technology

    Modern digital systems rely on secure ways to share and verify information. One innovation reshaping this landscape is a decentralized system that stores records across multiple computers instead of a single server. This approach creates a transparent network where no single entity controls the data, reducing risks of manipulation or fraud.

    blockchain

    At its core, this technology groups transactions into chronologically ordered blocks. Each block connects to the previous one using advanced cryptography, forming an unbreakable chain. Network participants validate new entries through agreed-upon rules, ensuring everyone’s records stay synchronized without intermediaries.

    Industries from healthcare to logistics now use these systems to improve accountability. For example, supply chains track goods in real time, while hospitals securely manage patient records. The tamper-proof nature of the data makes it ideal for scenarios requiring high levels of trust.

    Understanding how this framework operates helps businesses and individuals adopt safer, more efficient practices. Its ability to provide transparent, immutable records positions it as a cornerstone of future digital infrastructure.

    Key Takeaways

    • Decentralized networks eliminate single points of failure for enhanced security
    • Transactions are permanently recorded in linked blocks using cryptography
    • Consensus mechanisms ensure agreement across all network participants
    • Applications extend to supply chains, healthcare, and identity verification
    • Provides transparent tracking of data changes over time
    • Reduces reliance on third-party validators in digital transactions

    Overview of Blockchain Technology

    Businesses increasingly require systems that enable secure, real-time data sharing while preventing unauthorized changes. This demand has driven adoption of distributed ledger technology, which maintains identical records across multiple locations. Unlike traditional databases, this approach ensures all participants share a single source of truth without centralized control.

    Defining Core Concepts

    The framework organizes data into timestamped groups called blocks. Each block connects to prior entries using cryptographic hashes, forming an unbroken sequence. This design makes historical records practically impossible to alter retroactively.

    Three pillars define the system’s effectiveness:

    • Decentralization: No single entity governs the entire network
    • Transparency: All authorized users view the same ledger
    • Consensus protocols: Automated rules validate new entries

    Organizations use these features to track assets or agreements with unmatched precision. Supply chains verify product origins, while financial institutions settle cross-border payments in minutes. The technology’s immutable audit trail reduces disputes and builds trust between parties.

    History and Evolution of Blockchain

    The digital revolution found a new cornerstone in 2008 when an anonymous developer published the Bitcoin whitepaper. This breakthrough introduced a peer-to-peer cryptocurrency system that eliminated banks from financial transactions. For the first time, users could exchange value globally without centralized oversight.

    From Bitcoin Origins to Smart Contracts

    Bitcoin’s underlying framework solved a critical problem: preventing duplicate spending of digital assets. Its public ledger recorded transactions across thousands of computers, creating unprecedented security. This innovation laid the groundwork for modern decentralized systems.

    Ethereum’s 2015 launch marked the next evolutionary leap. Developers gained tools to create smart contracts—self-executing agreements triggered by predefined conditions. Suddenly, complex deals could automate without lawyers or notaries.

    Today’s applications stretch far beyond finance. Supply chains track goods using tamper-proof records, while artists sell unique digital collectibles through NFTs. Major industries now prioritize interoperability with AI and IoT devices.

    Market analysts project explosive growth, forecasting nearly $1 trillion in value by 2032. As scalability improves, this technology reshapes how businesses verify ownership and enforce agreements worldwide.

    How Blockchain Works

    Digital records gain trustworthiness when multiple parties verify and preserve them collectively. This principle powers systems where every action creates permanent, traceable entries. Participants collaborate to maintain accuracy without relying on central authorities.

    blockchain transactions

    Block Structure and Data Linking

    Every action within the network becomes a timestamped record stored in digital containers called blocks. These containers hold details like involved parties, timestamps, and asset specifics. Each new block connects to its predecessor using cryptographic codes called hashes.

    This linking creates an unbroken sequence where tampering with one block invalidates all following entries. Imagine a security seal that breaks if altered—the chain’s design makes unauthorized changes instantly detectable. Hashes act as unique fingerprints, ensuring data remains in its original sequence.

    Understanding Consensus Mechanisms

    Network validators use predefined rules to approve additions to the chain. Proof of Work requires solving complex puzzles, while Proof of Stake selects validators based on their holdings. Both methods prevent fake entries by making manipulation economically impractical.

    Approved blocks receive multiple confirmations from independent nodes. This distributed verification eliminates single points of failure. Over time, the growing chain becomes increasingly resistant to modification, creating a permanent history of verified actions.

    Blockchain Network Types

    Different organizational needs require tailored approaches to digital record-keeping. Four primary architectures have emerged to serve varying requirements for transparency, control, and collaboration. Each model offers unique advantages based on participation rules and data management policies.

    blockchain network types

    Public and Private Networks

    Public networks operate as open ecosystems where anyone can join without approval. These systems prioritize decentralization, allowing participants to verify transactions equally. However, their transparent nature may expose sensitive data and require significant computational resources.

    Private networks function under single-organization control, determining who gains access and what actions they can perform. This structure enhances privacy and speeds up transaction validation since fewer nodes participate. Corporations often choose this model for internal processes requiring strict data governance.

    Permissioned and Consortium Systems

    Permissioned systems blend aspects of public and private networks by restricting participation to authorized users. Organizations grant access rights based on predefined roles, ensuring only verified participants can submit or validate entries. This approach suits industries needing selective transparency, like healthcare data sharing.

    Consortium networks involve multiple organizations jointly managing ledger operations. Energy providers, for example, use this model to track renewable power distribution across regional grids. Shared responsibility reduces individual maintenance costs while maintaining audit standards across all members.

    Blockchain Benefits: Security, Transparency, and Efficiency

    Organizations across industries now prioritize three critical factors in data management: protection against breaches, visibility into operations, and streamlined workflows. Distributed systems address these needs through unique structural advantages that traditional databases can’t match.

    Enhanced Security and Trust

    Decentralized validation forms the backbone of improved security. Multiple network members must confirm each entry’s accuracy before permanent recording. This approach eliminates single points vulnerable to attacks.

    Once added, records become unchangeable. Cryptographic hashes lock data in sequence, making unauthorized edits instantly detectable. Even administrators can’t alter historical entries, creating reliable audit trails.

    Automated Transactions and Reduced Costs

    Smart contracts cut manual work by executing agreements automatically. When preset conditions occur—like shipment deliveries—payments process without delays. This reduces errors and speeds up operations.

    Transparency improves as all participants view identical ledgers. Companies save time previously spent reconciling mismatched records. Third-party fees vanish when direct peer-to-peer verification handles trust-building.

    These systems slash operational costs by 30-50% in sectors like logistics and finance. Real-time tracking combined with tamper-proof records creates leaner, more accountable business models.

    Smart Contracts and Practical Applications

    Digital agreements now enforce themselves through preprogrammed logic, eliminating paperwork delays. These self-executing tools operate on distributed systems, turning contractual terms into automated actions when conditions trigger. Smart contracts redefine trust by making intermediaries obsolete while ensuring precise execution.

    Self-Executing Agreements and Their Impact

    Code-based contracts automatically transfer assets, release payments, or update records without human oversight. A travel insurance payout activates when flight data confirms cancellation. Corporate bonds change hands instantly upon meeting maturity dates. This automation slashes processing times from weeks to minutes.

    Key industries already benefit:

    • Real estate: Property titles transfer automatically after payment verification
    • Healthcare: Patient data shares securely between approved providers
    • Logistics: Shipments trigger payments upon GPS-confirmed delivery

    “Smart contracts reduce operational costs by 35% in sectors adopting automated workflows.”

    2024 Gartner Business Process Report

    These applications minimize errors caused by manual data entry. Legal disputes drop when terms exist as immutable code visible to all parties. Businesses gain efficiency through standardized processes that execute identically every time.

    As adoption grows, industries discover new ways to encode complex agreements. Multi-step transactions—like supply chain financing—now resolve in hours instead of months. The shift toward automated contracts reshapes how organizations enforce accountability while cutting overhead.

    Blockchain Protocols and Platforms

    Diverse organizational needs drive the adoption of specialized ledger systems. Enterprises select frameworks based on scalability requirements, privacy controls, and industry-specific compliance standards. Leading platforms balance flexibility with robust security to serve sectors ranging from finance to healthcare.

    Key Platforms and Protocols in Use

    Hyperledger Fabric, developed by the Linux Foundation, dominates enterprise adoption with modular architecture. Its plug-and-play components let businesses customize transaction workflows while maintaining interoperability. Financial institutions often leverage its permissioned networks for asset tracking.

    Ethereum remains the go-to platform for decentralized applications requiring smart contract functionality. Unlike closed systems, its open-source environment supports public innovation through developer-friendly tools. Startups frequently build tokenized services on this network.

    Comparing Enterprise Solutions

    Corda prioritizes confidential business transactions through strict access controls. Designed for banks and insurers, it enables direct peer-to-peer agreements without broadcasting details network-wide. Quorum—an Ethereum derivative—enhances privacy for supply chain applications needing audit trails.

    Each platform addresses unique challenges. Hyperledger excels in consortium environments, Ethereum powers transparent ecosystems, and Corda secures sensitive partnerships. Businesses evaluate transaction speed, governance models, and integration costs when choosing technology solutions.

    FAQ

    What problem does distributed ledger technology solve?

    It addresses trust gaps in digital transactions by creating tamper-proof records. Through decentralization and cryptographic validation, participants can verify data without relying on intermediaries like banks or governments.

    How do consensus mechanisms ensure network integrity?

    Protocols like Proof of Work (used by Bitcoin) or Proof of Stake (adopted by Ethereum) require participants to validate transactions collectively. This prevents fraud and maintains agreement across nodes, even in untrusted environments.

    Are private networks less secure than public ones?

    Not necessarily. Private systems, such as Hyperledger Fabric, restrict access to authorized users, reducing exposure to attacks. However, public chains like Bitcoin offer stronger decentralization, which can enhance resilience against manipulation.

    Can smart contracts operate without human intervention?

    Yes. Platforms like Ethereum execute code automatically when predefined conditions are met. For example, insurance payouts trigger instantly after verified flight delays, eliminating manual claims processing.

    Why do industries like supply chain management adopt this technology?

    Real-time tracking of goods across partners reduces delays and errors. Walmart’s food traceability system, built on IBM’s Food Trust network, slashes investigation times for contamination issues from days to seconds.

    What distinguishes Ethereum from enterprise platforms like Corda?

    Ethereum focuses on programmable public networks for decentralized apps, while Corda prioritizes privacy for financial institutions. R3’s Corda allows selective data sharing, whereas Ethereum transactions are transparent by default.

    Does implementing these systems increase operational costs?

    Initial setup requires investment, but long-term savings emerge through automated workflows. Deloitte estimates businesses using DLT reduce reconciliation expenses by up to 50% through streamlined record-keeping.

  • Crucial Risk Management Tactics for Scalping Traders

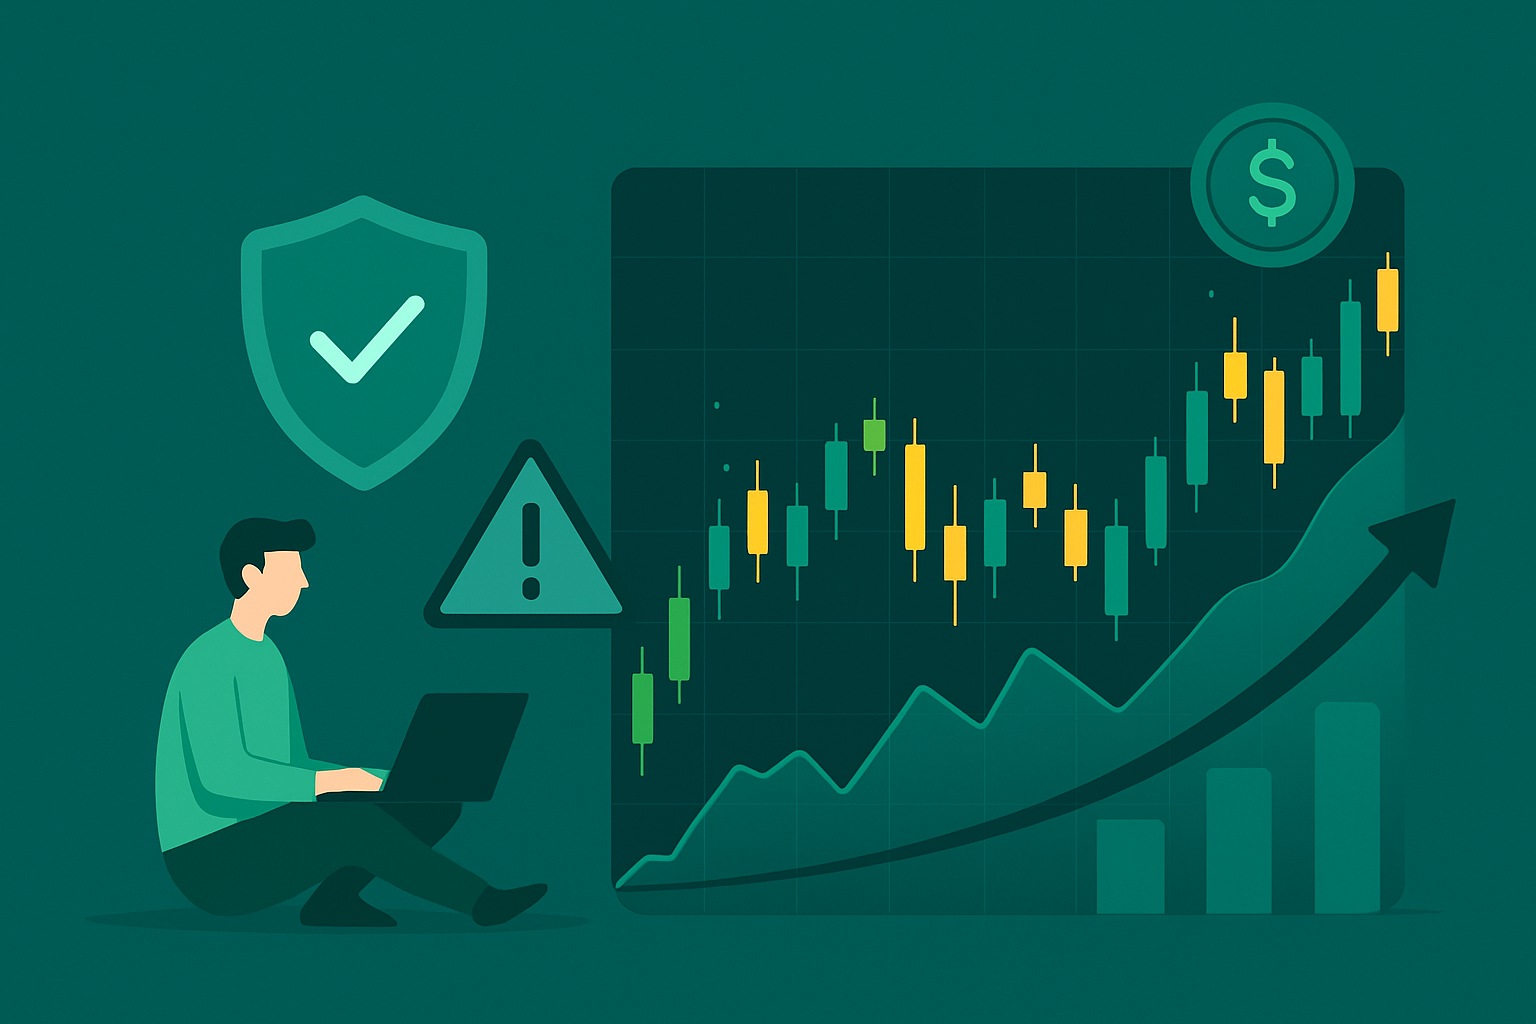
    Crucial Risk Management Tactics for Scalping Traders

    Scalping involves executing dozens of trades daily to profit from tiny price shifts, often within seconds or minutes. This high-frequency approach demands constant market monitoring and split-second decisions. While the strategy offers frequent opportunities, it also exposes participants to amplified pressure and potential pitfalls.

    Crucial Risk Management Tactics for Scalping Traders

    Successful practitioners rely on systematic protocols to prevent minor losses from compounding. Tools like real-time data feeds and rapid execution platforms become essential allies in this fast-paced environment. Without disciplined controls, even skilled individuals can see their gains evaporate quickly.

    The most effective approaches balance aggressive trade frequency with protective measures. This guide explores practical methods for setting position limits, establishing exit triggers, and locking in profits. It also examines how market volatility and asset selection influence outcomes.

    Key Takeaways

    • High-frequency trading requires precision tools and instant decision-making capabilities
    • Small losses can rapidly accumulate without strict position-sizing rules
    • Automated exit strategies help maintain discipline during volatile price swings
    • Market liquidity directly impacts trade execution quality and profitability
    • Psychological resilience separates consistent performers from impulsive actors

    Understanding Scalping and Its Market Dynamics

    Modern scalping strategies thrive on exploiting momentary market inefficiencies. This approach focuses on capturing fractional price changes across currencies, indices, or equities. Unlike long-term investors, scalpers operate in compressed timeframes where seconds determine success or failure.

    Defining Scalping in Modern Trading

    Scalping involves executing numerous trades daily to profit from small price movements. Traders rely on technical indicators like Bollinger Bands and stochastic oscillators to pinpoint entry and exit points. The strategy demands real-time data analysis and split-second execution to capitalize on fleeting opportunities.

    Forex markets dominate scalping activities due to high liquidity and 24-hour accessibility. Major currency pairs like EUR/USD provide tight spreads, reducing transaction costs. Scalpers often trade during overlapping market hours when volatility peaks.

    Key Characteristics and Market Conditions

    Successful scalping requires specific market conditions:

    FactorRequirementImpact
    LiquidityHigh volumeMinimizes slippage
    VolatilityModerate fluctuationsCreates price opportunities
    SpreadLow bid-ask gapReduces entry costs

    Scalpers monitor order flow and market depth to anticipate price shifts. They adjust strategies based on whether markets trend or consolidate. Morning sessions in major financial hubs often yield optimal conditions due to institutional trading activity.

    Fundamentals of Risk Management in Trading

    Protecting capital is the bedrock of any successful short-term trading approach. Rapid-fire strategies demand precise controls to prevent minor setbacks from becoming account-draining disasters. Systematic protocols separate sustainable methods from reckless gambling in volatile markets.

    stop-loss position sizing

    Importance of Stop-Loss Orders and Position Sizing

    Stop-loss orders act as emergency brakes for trades gone wrong. These automated triggers close positions when prices hit predetermined levels, shielding accounts from emotional decisions. Scalpers often set stops within 5-10 pips of entry points in forex markets.

    Position sizing determines how much capital to risk per trade. A common rule limits exposure to 1% of total account value. This table shows key calculations:

    ParameterPurposeImplementation
    Position SizeControl per-trade exposureAccount balance × risk % ÷ stop distance
    Stop-Loss LevelDefine maximum lossTechnical analysis + spread consideration
    Daily LimitPrevent cumulative losses5% of account balance maximum

    Effective risk management requires balancing aggressive trading with protective measures. Traders who ignore position sizing often blow accounts during unexpected market swings. The 1% rule allows surviving 20 consecutive losses before capital depletion.

    Market conditions influence stop placement. Tight stops work in stable markets, while volatile sessions need wider buffers. Successful traders adjust parameters based on asset behavior and economic event calendars.

    Crucial Risk Management Tactics for Scalping Traders

    Precision profit targeting separates sustainable scalping methods from fleeting attempts. Traders must define clear objectives before entering positions to combat market unpredictability. This approach transforms random outcomes into measurable results.

    profit targets scalping strategy

    Setting Realistic Profit Targets

    Effective traders analyze historical price movements to determine achievable goals. They study how assets behave during specific sessions and volatility periods. This data shapes profit expectations aligned with actual market conditions.

    A systematic approach considers three key factors:

    Market FactorIdeal ConditionTarget Impact
    VolatilityModerate fluctuations1-3 pip goals
    SpreadUnder 0.5 pipsReduces cost burden
    LiquidityHigh volumeEnsures order execution

    Professional scalpers often set multiple exit points. They might close 50% of a position at 2 pips profit and let the remainder ride with trailing stops. This balances immediate gains with extended opportunities.

    Psychological discipline proves vital when prices approach target levels. Many traders sabotage results by moving goalposts mid-trade. Sticking to predefined plans prevents emotional interference during fast-paced sessions.

    Successful strategies incorporate risk-reward ratios of at least 1:1.5. This means aiming for 1.5 pips profit for every pip risked. Such frameworks maintain profitability even with moderate win rates.

    Leveraging Technical Analysis and Key Indicators

    Technical analysis serves as the compass for navigating fast-paced markets. Unlike long-term investors, scalpers depend on real-time chart patterns and mathematical models to guide decisions. This approach transforms chaotic price movements into actionable signals.

    Utilizing Moving Averages and Oscillators

    Exponential moving averages (EMA) act as dynamic roadmaps in volatile conditions. A 5-period EMA often reveals immediate trend direction, while the 20-period EMA highlights broader momentum shifts. These tools help traders spot potential reversals during rapid price fluctuations.

    Momentum oscillators add precision to timing decisions:

    IndicatorPrimary RoleOptimal Use
    RSIIdentify overbought/oversold zones30-70 levels in ranging markets
    StochasticPredict short-term reversalsCrossovers above 20 or below 80
    MACDConfirm trend strengthHistogram divergence signals

    Identifying Support and Resistance Levels

    Price levels where buyers and sellers clash become critical decision points. These zones often repeat across multiple timeframes, creating high-probability trade areas. Scalpers use three methods to pinpoint them:

    • Previous day’s high/low markers
    • Fibonacci retracement clusters
    • Volume-weighted price averages

    Combining these levels with moving averages creates confirmation signals. For example, a bounce off support with rising RSI suggests strong buying pressure. Traders then execute orders with tighter stop-loss placements below these strategic points.

    Effective Entry and Exit Strategies for Scalpers

    Mastering precise entry and exit timing separates profitable scalpers from those who struggle. This approach demands analyzing multiple technical signals while maintaining emotional discipline. The right combination of chart patterns and execution speed creates consistent trading opportunities in volatile markets.

    Pinpointing Entry Points With Technical Signals

    Seasoned traders wait for alignment between indicators before entering positions. A doji candlestick near a moving average crossover often signals potential reversals. Three common patterns guide decisions:

    PatternConfirmation SignalTypical Outcome
    Bullish EngulfingVolume spike + RSI reversalUpward breakout
    Bearish HaramiMACD divergenceDownward momentum
    Hammer FormationStochastic crossoverSupport bounce

    Advanced practitioners combine these signals with order flow data. They track large buy/sell clusters in the order book to identify high-probability entry points. This multi-layered analysis reduces false signals during choppy sessions.

    Optimizing Exit Points to Lock in Gains

    Exit strategies require equal attention to entry techniques. Many traders use trailing stops that adjust with price momentum. A 1:2 risk-reward ratio proves effective – closing half the position at 2x the stop-loss distance.

    Four exit triggers dominate successful strategies:

    • Price reaches predefined profit targets
    • Technical indicators show weakening momentum
    • Spread widens beyond acceptable levels
    • Time-based exits after 2-3 minutes

    Adapting to changing conditions separates professionals from amateurs. When volatility drops unexpectedly, smart scalpers exit positions rather than hoping for reversals. This discipline preserves capital for better trading opportunities.

    Adapting to Changing Market Conditions

    Successful traders evolve with shifting financial landscapes like surfers adjusting to wave patterns. Market behavior fluctuates between calm and chaotic phases, requiring strategic flexibility. Recognizing these transitions early separates consistent performers from those caught off-guard.

    Monitoring Volatility and Liquidity Dynamics

    Volatility tracking involves analyzing price swing frequency and magnitude across multiple charts. Professionals watch shorter timeframes (1-5 minute charts) for immediate signals while checking hourly trends for context. This dual perspective helps identify emerging patterns before they dominate price action.

    Liquidity evaluation determines execution reliability during different trading sessions. Major forex pairs typically show tight spreads during London/New York overlaps. Cryptocurrency markets require extra caution around news events that can drain liquidity rapidly.

    Three critical adaptation techniques:

    • Switching between trending and range-bound strategies based on ATR readings
    • Adjusting position sizes when spreads widen unexpectedly
    • Using volatility-indexed stop-loss distances during earnings announcements

    Economic calendars guide proactive adjustments. Savvy traders reduce activity before high-impact news, then capitalize on the subsequent price surges. This balanced approach leverages market conditions rather than fighting them.

    Real-time data integration proves essential. Streaming VIX values and order book depth indicators help make informed decisions. As one veteran notes: “The market whispers its intentions through liquidity flows – learn to listen.”

    Managing Transaction Costs and Trading Platform Efficiency

    In high-frequency environments, every pip and millisecond impacts outcomes. Transaction costs accumulate rapidly when executing hundreds of trades daily, making fee structures as important as price movements. Savvy operators treat spread analysis and execution speed as non-negotiable components of their workflow.

    Reducing Brokerage Fees and Minimizing Slippage

    Broker selection directly affects net profits through commission rates and order routing quality. Many platforms offer tiered pricing for active traders, with reduced fees for high-volume day trading activity. Comparing spread averages across multiple sessions reveals cost-efficient partners.

    Slippage prevention requires understanding liquidity patterns. Tight spreads during peak trading hours help maintain predictable entry/exit points. Direct market access brokers often provide faster execution than standard platforms, particularly during news-driven volatility.

    Three cost-control strategies prove essential:

    • Negotiating volume-based commission discounts
    • Using price alerts to avoid chasing moves
    • Testing platforms through demo accounts before live use

    Latency under 50 milliseconds becomes critical when scalping volatile instruments. Advanced traders monitor execution reports to identify requotes or partial fills that erode profits. Regular platform performance reviews ensure technological edge remains sharp.

    FAQ

    How do scalpers identify optimal entry and exit points?

    Scalpers rely on technical signals like candlestick patterns, moving averages, or RSI divergences to time entries. Exits are often based on pre-set profit targets or shifts in momentum, with trailing stops used to protect gains during rapid price movements.

    Why are support and resistance levels critical for scalping strategies?

    These levels act as psychological price barriers where buying or selling activity intensifies. Scalpers use them to predict short-term reversals or breakouts, enabling precise trade setups with tighter stop-loss placements.

    What tools help scalpers adapt to volatile market conditions?

    Real-time charting platforms like TradingView, volatility indicators such as Bollinger Bands®, and Level II data assist in tracking liquidity shifts. Scalpers may also adjust position sizes or avoid trading during major news events like FOMC announcements.

    How do transaction costs impact scalping profitability?

    High-frequency trades amplify brokerage fees and slippage. Using direct market access (DMA) brokers like Interactive Brokers or commission-free platforms such as Robinhood can reduce costs, while limit orders minimize unfavorable price fills.

    Which technical indicators are most effective for scalping?

    Fast-moving tools like the 5-period EMA, Stochastic Oscillator, and MACD histogram are popular. Volume profile indicators and VWAP (Volume-Weighted Average Price) also help confirm intraday trends and liquidity zones.

    How do scalpers manage risk during erratic price swings?

    They employ strict stop-loss orders—often 1-3 pips below entry—and cap position sizes to 1-2% of their capital per trade. Some use hedging strategies via correlated assets or derivatives to offset sudden losses.

    What role does a trading platform’s speed play in scalping success?

    Latency under 50 milliseconds is vital for executing rapid trades. Platforms like MetaTrader 5, cTrader, or proprietary software used by firms like Jump Trading provide one-click order execution and customizable hotkeys for split-second decisions.

  • What is MetaTrader 5 (MT5)? Your Guide to the Trading Platform

    What is MetaTrader 5 (MT5)? Your Guide to the Trading Platform

    Since its launch in 2010, the multi-asset trading platform developed by MetaQuotes has become a cornerstone for modern investors. Designed as an evolution of its predecessor, this software supports diverse financial instruments, from forex to cryptocurrencies, while offering direct access to exchanges for stocks and futures.

    What is MetaTrader 5 (MT5)

    The platform’s architecture caters to both casual and professional traders. Unlike earlier versions, it combines CFD trading with real-market execution, enabling strategies across global markets. Advanced charting tools, algorithmic trading systems, and risk management features meet the demands of high-frequency operations.

    Brokers worldwide rely on its infrastructure to deliver institutional-grade capabilities to retail users. With support for over 20 timeframes and 80 technical indicators, traders gain actionable information to navigate volatile conditions. Its automated trading functionality and copy-trading options further democratize access to sophisticated strategies.

    Key Takeaways

    • Supports trading across forex, stocks, indices, cryptocurrencies, and commodities
    • Enables direct market access alongside CFD trading capabilities
    • Features advanced charting tools and 80+ technical indicators
    • Trusted by brokers globally for institutional-grade performance
    • Offers automated trading systems and social trading features

    Overview of MetaTrader 5 and Its Capabilities

    Modern trading demands precision and adaptability, qualities embedded in this multi-asset platform. Designed to empower users across experience levels, it combines advanced technology with intuitive workflows for analyzing global opportunities.

    Key Features and Tools

    The platform’s analytical tools set industry standards. Traders access 80+ technical indicators and 46 drawing objects like Fibonacci retracements and trendlines. Customizable charts display 21 timeframes, from one-minute ticks to monthly trends, enabling granular market analysis.

    Automation reshapes strategy execution. Algorithmic trading systems execute orders faster than manual methods. Copy trading bridges skill gaps by letting users mirror top performers’ moves in real time.

    Benefits for Traders in Financial Markets

    Diversification becomes effortless with access to six asset classes. Forex pairs, stocks, and cryptocurrencies coexist in one workspace. Real-time news feeds and economic calendars highlight events affecting financial markets.

    Risk management tools like trailing stops protect profits during volatility. Backtesting evaluates strategies against decades of data, reducing trial-and-error learning. These features create a balanced environment for informed decisions.

    Background and Evolution of MT5

    Five years after revolutionizing forex trading, MetaQuotes launched a more versatile trading platform in 2010. This upgrade addressed growing demands for diversified asset access beyond currency markets. The redesigned architecture supported stocks, futures, and exchange-traded instruments – a leap forward from single-market focus.

    From MT4 to MT5: The Transition

    The shift between versions transformed retail trading capabilities. Developers rebuilt the core system to handle complex order types and multi-threaded strategy testing. Enhanced market depth displays now show real-time liquidity across global exchanges.

    Key improvements emerged from user feedback collected during MT4’s dominance. Execution speeds increased by 70%, while memory optimization allowed deeper historical analysis. These changes catered to algorithmic traders requiring precision in fast-moving markets.

    FeatureMT4MT5
    Asset ClassesForex/CFDs6+ including stocks
    Execution Modes2 types4 modes
    Technical Tools30 indicators80+ indicators
    Market DepthBasicLevel II data
    BacktestingSingle-threadMulti-threaded

    While retaining popularity among forex specialists, the upgraded platform attracted equity investors and institutional users. Regular updates maintain its position as a cutting-edge solution for modern market challenges.

    Understanding the Multi-Asset Trading Ecosystem

    Global financial markets demand tools that unify diverse opportunities. The trading platform bridges retail investors and institutional resources, offering access to six asset classes through one interface. Users analyze forex pairs alongside stock indices while monitoring crypto volatility – all within the same workspace.

    multi-asset trading platform features

    Flexibility defines how traders interact with markets. Over-the-counter CFD positions coexist with direct exchange access for physical shares. This dual approach lets investors hedge portfolios using futures contracts while speculating on commodities through leveraged instruments.

    Market TypeExecution MethodKey Advantage
    Forex/CFDsInstant ExecutionLeverage up to 1:1000
    Stock ExchangesDirect Market AccessReal Ownership
    Crypto Markets24/7 TradingVolatility Opportunities
    FuturesExchange-TradedStandardized Contracts

    Advanced infrastructure processes 10,000+ quotes per second across global markets. Risk controls automatically adjust position sizes based on account equity. Liquidity aggregation ensures tight spreads during high-impact news events.

    Third-party integrations expand functionality beyond core features. Algorithm developers connect custom indicators while fund managers automate portfolio rebalancing. This adaptability makes the platform suitable for both casual traders and hedge funds executing complex strategies.

    How to Set Up Your MT5 Account

    Establishing a functional trading environment begins with proper account configuration. This process determines your market access, tools availability, and risk exposure management.

    MT5 account setup

    Broker Selection and Platform Installation

    Choosing a licensed broker forms the foundation of your setup. Prioritize firms with:

    • Regulatory compliance (FINRA/SEC in the US)
    • Competitive spreads and commission structures
    • 24/5 customer support channels

    After selecting a provider, download the platform from their official website or MetaQuotes. Installation typically takes under three minutes across Windows, macOS, iOS, or Android devices.

    Practice Versus Real-Market Engagement

    Demo accounts simulate trading conditions using virtual funds. Traders gain:

    • Familiarity with order execution mechanics
    • Strategy testing capabilities
    • Technical indicator experimentation

    Live accounts require identity verification and financial disclosures. Transitioning between modes demands emotional preparation – real capital introduces psychological factors absent in simulations.

    FeatureDemo AccountLive Account
    CapitalVirtual ($10k-$100k)Real Funds
    PurposeSkill DevelopmentProfit Generation
    Market ImpactNoneActual Execution

    Navigating the MT5 Trading Platform

    Mastering the interface unlocks full potential for market participants. The customizable workspace adapts to various strategies through drag-and-drop panels and adjustable color schemes. Three core components dominate the layout: real-time quotes in Market Watch, strategy elements in Navigator, and trade monitoring through Terminal.

    Optimizing Workspace Layout

    Professional traders arrange charts alongside economic calendars and news feeds. Multiple monitor setups display price action across different assets simultaneously. Saved templates recall preferred configurations with one click, saving hours during volatile sessions.

    Advanced Charting Techniques

    Nine drawing tools transform raw data into actionable insights. Users plot Fibonacci retracements directly on candlestick patterns or mark support zones with horizontal lines. Over 80 built-in indicators like Bollinger Bands overlay charts, revealing hidden market trends.

    The platform processes multiple timeframes without lag. Analyze 15-minute scalping opportunities while tracking weekly trend directions. Custom alerts notify traders when prices breach specified levels, ensuring no crucial movement goes unnoticed.

    Algorithm enthusiasts build indicator combinations through visual editor tools. Saved presets apply complex technical analysis across all open charts. This efficiency proves vital when managing diverse portfolios under time constraints.

    Placing and Managing Orders in MT5

    Effective order execution separates successful traders from the crowd. The platform’s order management system offers precision control over entries and exits, balancing speed with strategic planning.

    Market vs. Conditional Execution

    Traders activate market orders through the F9 shortcut for instant price matching. These execute immediately, ideal for capturing rapid movements during earnings reports or economic data releases. Pending orders like buy limits or sell stops let users set precise activation thresholds, automating entries at predefined levels.

    Protecting Positions Strategically

    Stop-loss parameters automatically close losing trades before losses escalate. Take-profit levels lock gains when targets hit, eliminating emotional decision-making. Combined with trailing stops that follow favorable price movements, these tools form a robust risk management framework.

    The order window’s volume selector adjusts position sizes based on account equity. Execution types range from instant fills to exchange-quoted requests, accommodating different trading styles. By mastering these features, users transform random trades into calculated market engagements.

    FAQ

    How does MetaTrader 5 differ from its predecessor MT4?

    MetaTrader 5 offers advanced features like more order types, improved execution speeds, and access to diverse markets, including stocks and futures. Unlike MT4, it supports hedging and netting modes, deeper technical analysis tools, and an economic calendar integrated into the platform.

    Can traders automate strategies on the platform?

    Yes. The platform supports algorithmic trading through Expert Advisors (EAs) and custom trading robots. Users can code strategies via MQL5 or utilize pre-built solutions from the MetaTrader Market for automated execution.

    What markets are accessible through the platform?

    Users trade forex, CFDs, stocks, commodities, indices, and cryptocurrencies. The platform aggregates multiple asset classes, allowing diversification across global financial markets within a single interface.

    Are there risks when using a demo account?

    Demo accounts simulate real-market conditions without financial risk. However, emotional discipline and execution delays may differ from live trading. Traders should transition carefully after testing strategies thoroughly.

    How do pending orders enhance trade execution?

    Pending orders like Buy Limit or Sell Stop let traders set entry points in advance. These tools help capitalize on price movements without constant monitoring, improving precision in volatile markets.

    Does the platform support mobile trading?

    Yes. MetaTrader 5 provides iOS and Android apps with full functionality, including real-time charts, order management, and push notifications. Traders monitor positions and execute trades from any device seamlessly.

    What analytical resources are available?

    The platform includes 38 technical indicators, 44 graphical objects, and 21 timeframes. Traders also access tick charts, market depth data, and third-party plugins for advanced analysis or backtesting strategies.

    Can multiple accounts be managed simultaneously?

    Yes. Users link several live or demo accounts to one login. This feature streamlines portfolio management for those operating across brokers or balancing different risk profiles.

  • How Long Does It Take to Learn Forex?

    How Long Does It Take to Learn Forex?

    How Long Does It Take to Learn Forex?

    Gaining expertise in currency markets demands sustained effort and strategic practice. Most individuals require 6–12 months of daily study to grasp core concepts like technical patterns and economic indicators. Those committing 2–4 hours daily often develop functional skills faster than casual learners, though market mastery typically extends beyond a year.

    Success hinges on balancing theoretical knowledge with real-world application. Analyzing charts, managing risks, and maintaining emotional control form the foundation of sustainable trading. Prior experience in financial markets or analytical fields may shorten the initial learning phase for some traders.

    The path diverges sharply between basic competence and consistent profitability. While foundational skills emerge within months, refining strategies through evolving market conditions often takes 1–2 years. Modern educational tools and trading platforms accelerate skill development but cannot replace hands-on experience.

    Key Takeaways

    • Currency market proficiency typically requires 6–24 months of dedicated study and practice
    • Daily commitment of 2–4 hours accelerates skill development compared to sporadic learning
    • Technical analysis and risk management form the core of effective trading strategies
    • Market conditions and psychological discipline separate theoretical knowledge from profitable execution
    • Continuous adaptation remains essential as global economic factors reshape trading landscapes

    Understanding the Basics of Forex Trading

    Navigating global currency exchanges starts with mastering fundamental tools and language. This foundation separates informed decisions from speculative guesses in fast-paced markets.

    Key Terminology and Concepts

    Pips measure price changes down to 0.0001 for most pairs. A spread reflects the gap between buying and selling prices – tighter spreads often signal better liquidity. Standard lot sizes equal 100,000 currency units, though mini/micro lots allow smaller trades.

    Leverage ratios like 50:1 amplify both gains and risks. Margin requirements dictate how much capital traders must hold to maintain positions. These mechanics demand disciplined risk management strategies.

    Overview of Currency Pairs and Trading Mechanics

    Major pairs like EUR/USD dominate forex market activity with high liquidity. Exotic pairs involve less common currencies and wider spreads. Prices react to economic reports, geopolitical shifts, and central bank policies.

    Three primary order types shape execution strategies:

    • Market orders execute instantly at current prices
    • Limit orders trigger at specified levels
    • Stop-loss orders automatically close losing positions

    Commercial banks and institutional traders drive significant currency flows, while retail participants access markets through online platforms. Understanding these dynamics helps interpret price movements across Asian, European, and US trading sessions.

    The Journey from Beginner to Advanced Trader

    Mastering currency markets follows a structured progression requiring distinct skill development phases. Traders evolve through three critical competency levels, each demanding specific focus areas and practical application.

    Stages of Learning Forex

    Newcomers typically spend their initial three months absorbing market fundamentals. Essential knowledge includes understanding exchange mechanisms, major currency pairs, and basic economic drivers like inflation rates.

    StageDurationFocus AreaKey Tools
    Foundation1-3 monthsMarket structureEconomic calendars
    Skill Building3-6 monthsStrategy developmentBacktesting software
    Execution6+ monthsLive tradingRisk management tools

    Intermediate traders shift focus to technical analysis patterns and historical data testing. This phase often reveals whether a strategy can withstand volatile market conditions.

    Transitioning from Demo Accounts to Live Trading

    Simulated accounts provide safe environments to test strategies without financial risk. Successful beginners typically log 100+ demo trades before handling real money.

    The switch to live markets requires emotional control drills. Start with micro-lots representing 1% of capital. Gradually increase position sizes as consistency improves over several months.

    Seasoned traders emphasize journaling every decision during this critical process. Documenting wins and losses accelerates learning while reinforcing disciplined habits essential for long-term success.

    How Long Does It Take to Learn Forex? – Key Factors to Consider

    factors influencing forex learning duration

    Prior financial experience acts as a turbocharger for skill development. Traders with economics backgrounds or stock market exposure typically decode currency patterns 30-40% faster than novices. This advantage stems from familiarity with terms like leverage ratios and macroeconomic indicators.

    Daily practice duration separates rapid progress from stagnation. Those investing 2-4 focused hours daily often achieve basic competence in 5-8 months. Sporadic learners might require 18+ months to reach similar milestones.

    Educational quality creates dramatic differences in outcomes. Professional trading courses with structured curricula outperform free YouTube tutorials by 58% in skill retention metrics. Mentorship programs further compress learning curves through personalized feedback loops.

    Strategy complexity dictates practice requirements. Simple moving average systems demand 80-120 hours of backtesting. Advanced algorithmic approaches might need 500+ hours across multiple market cycles. Analytical strengths help some traders process chart patterns 25% faster than peers.

    Consistent routines prove more effective than marathon sessions. Thirty-minute daily chart reviews combined with weekly strategy tests build sustainable habits. This disciplined approach reinforces concepts better than irregular eight-hour weekend study binges.

    The Role of Technical and Fundamental Analysis

    Market navigation demands dual analytical lenses that decode price movements and economic forces. Traders who master these complementary approaches gain significant advantages in predicting currency fluctuations.

    technical and fundamental analysis

    Technical Analysis Techniques

    Chart patterns reveal hidden market psychology through formations like head-and-shoulders or double tops. Three essential tools dominate this discipline:

    • Moving averages identify trend directions
    • RSI gauges overbought/oversold conditions
    • Fibonacci retracements predict reversal zones

    Pattern recognition skills typically solidify after 300+ hours of screen time. Most traders achieve basic proficiency within 5 months of daily chart reviews.

    Fundamental Analysis Insights

    Economic data releases create seismic market shifts. Key indicators include:

    Report TypeFrequencyMarket Impact
    CPI InflationMonthlyHigh
    Interest RatesQuarterlyExtreme
    GDP GrowthQuarterlyModerate-High

    Mastering fundamental analysis requires tracking geopolitical news and central bank communications. Traders often spend 8-10 months learning to interpret these complex relationships effectively.

    Combining both methods creates robust decision frameworks. Technical signals gain credibility when aligned with fundamental drivers, while economic data finds precise entry points through chart techniques. This synergy separates reactive traders from strategic market participants.

    The Importance of Daily Time Commitment and Practice

    Consistent daily effort separates successful currency traders from perpetual learners. Research shows market participants dedicating 2-4 focused hours daily often achieve operational readiness in 3-6 months, while those allocating under 60 minutes frequently require 12+ months. This disparity highlights the non-negotiable relationship between structured practice and skill acquisition.

    Structuring a Consistent Learning Routine

    Effective traders divide their study time into three core components:

    • Market analysis (40%): Chart pattern recognition and economic calendar reviews
    • Strategy testing (35%): Backtesting systems across multiple market conditions
    • Skill refinement (25%): Journaling trades and analyzing past decisions

    Short daily sessions outperform marathon weekend studies. Fifteen-minute price action reviews each morning build pattern recognition faster than sporadic three-hour sessions. Mobile trading apps enable professionals to monitor positions during commutes or breaks.

    Daily CommitmentSkill MilestoneTypical Timeline
    30-60 minutesBasic terminology4-6 months
    2-3 hoursConsistent demo results3-5 months
    4+ hoursLive account readiness2-4 months

    Quality practice demands eliminating distractions. Traders using noise-canceling headphones during study sessions report 28% better information retention. Evening review sessions solidify daily lessons through spaced repetition techniques.

    Progressive learning paths yield better results than random exploration. Start with candlestick patterns before advancing to Fibonacci retracements. Master risk management principles prior to experimenting with leverage. This structured approach prevents cognitive overload while building durable expertise.

    Risk Management and Trading Psychology

    Market success hinges on mental discipline as much as technical skill. While charts and indicators capture attention, 78% of failed traders cite psychological factors as their primary downfall according to industry studies. This critical aspect demands equal focus to strategy development.

    Managing Emotions in Trading

    Fear and greed sabotage more accounts than poor analysis. Traders typically require 6-12 months to build emotional resilience against market fluctuations. Key techniques include:

    Emotional ChallengePractical SolutionImplementation Time
    Revenge tradingMandatory 24-hour cooling periodImmediate
    Overconfidence3-trade maximum per strategy2-4 weeks
    Loss aversionPre-set stop-loss orders1 trading session

    Professional traders treat each decision as part of a statistical series rather than personal validation. This mindset reduces impulsive reactions to unexpected price movements.

    Establishing a Solid Trading Plan

    A robust trading strategy acts as both roadmap and emotional anchor. Essential components include:

    • Maximum 2% risk per trade
    • Clear entry/exit triggers
    • Weekly performance reviews

    Seasoned market participants spend 30-45 minutes daily updating their plans to reflect changing conditions. This discipline prevents emotional decisions during volatile sessions while protecting trading funds.

    Practical Training: From Demo Accounts to Real Trading

    Building trading expertise requires deliberate skill application across simulated and live environments. Demo accounts serve as laboratories for refining techniques before risking capital.

    Benefits of Practicing in a Demo Environment

    Virtual trading platforms let traders test strategies across historical data and live market feeds. This risk-free space reveals how economic news impacts currency pairs without financial consequences. Many discover flawed risk management habits during this phase.

    Extended demo periods expose users to diverse scenarios – from stable ranges to volatile breakouts. Six months of simulated trading typically builds muscle memory for order execution and platform navigation.

    Strategies for a Smooth Live Trading Transition

    Transitioning to real accounts demands phased scaling. Start with micro-lots representing 0.5-1% of capital. This approach lets traders experience emotional triggers while protecting their balance.

    Successful shifts require maintaining demo practice alongside live trade execution. Compare performance metrics between environments to identify psychological gaps. Documenting both wins and losses accelerates knowledge retention.

    Seasoned professionals recommend dedicating 30% of practice time to reviewing past trades. This habit sharpens decision-making skills while reinforcing disciplined market participation.

    FAQ

    What factors influence the time required to master forex trading?

    The learning curve depends on prior financial knowledge, time invested daily, quality of educational resources, and adaptability to market fluctuations. Traders who practice consistently with demo accounts and study price action often progress faster.

    Why is understanding currency pairs critical for beginners?

    Currency pairs dictate market behavior and trading costs. Familiarity with majors like EUR/USD or GBP/JPY helps traders analyze liquidity, spreads, and geopolitical influences, forming the foundation for strategic decisions.

    How does technical analysis differ from fundamental analysis in forex?

    Technical analysis focuses on chart patterns, indicators, and historical price data to predict trends. Fundamental analysis evaluates economic data, interest rates, and news events. Successful traders often blend both approaches.

    Can demo accounts accelerate the learning process?

    Yes. Platforms like MetaTrader 4 allow risk-free practice with virtual funds. Demo environments help refine entry/exit strategies, test trading plans, and build confidence before risking real capital.

    What role does psychology play in becoming a proficient trader?

    Emotional discipline prevents impulsive decisions driven by greed or fear. Techniques like journaling trades and setting stop-loss orders help maintain objectivity, a skill that often takes months to develop.

    How much daily practice is recommended for steady progress?

    Dedicate 1–2 hours daily to studying charts, reviewing economic calendars, and analyzing trades. Consistency matters more than marathon sessions—regular exposure sharpens pattern recognition and decision-making speed.

    What common mistakes prolong the learning phase for new traders?

    Overtrading, ignoring risk-reward ratios, and neglecting macroeconomic trends are frequent pitfalls. Beginners should prioritize mastering 2–3 strategies rather than chasing every market movement.

    When should traders transition from demo to live accounts?

    Move to live trading after consistently profitable demo results over 3–6 months. Start with micro-lots to manage real-money pressure while applying proven risk management rules.

    Further Reading

    1. BabyPips – School of Pipsology
      One of the most comprehensive beginner guides to learn forex step by step:
      👉 https://www.babypips.com/learn/forex
    2. Investopedia – Forex Trading for Beginners
      A solid introduction to forex basics, trading strategies, and key market concepts:
      👉 https://www.investopedia.com/articles/forex/06/forexforbeginners.asp
    3. DailyFX – How Long Does It Take to Learn Forex Trading?
      A practical breakdown of what influences the forex learning curve:
      👉 https://www.dailyfx.com/education/beginner/how-long-to-learn-forex-trading.html
  • The Ultimate Guide to the 1-Hour Swing Trading Strategy

    The Ultimate Guide to the 1-Hour Swing Trading Strategy

    Swing trading has long been a favorite approach for traders who want to capture price moves that develop over days or weeks. But what if you could take that same idea and condense it into a single focused session each day? Enter the 1-hour swing trading strategy — a short-term approach that blends the best aspects of swing and day trading into a clear, time-efficient plan.

    In this guide, you’ll learn what the 1-hour swing trading strategy is, why traders love it, the core tools you’ll need, and step-by-step ideas for putting it into practice — all with a focus on staying practical, disciplined, and profitable.


    What Is the 1-Hour Swing Trading Strategy?

    In simple terms, this strategy involves opening and closing trades within a one-hour timeframe. Instead of holding positions overnight or for several days, you concentrate your analysis and execution into that hour.

    This hybrid approach provides:

    • Enough price movement to catch meaningful swings.
    • A clear window for planning, entering, and exiting trades.
    • Less overnight risk compared to multi-day swing trades.

    Why Trade on the 1-Hour Chart?

    Here are some of the biggest advantages of the 1-hour swing trading approach:

    ✅ Time Efficiency

    You don’t have to sit at your desk all day watching charts. Many traders block off an hour — perhaps during high-volatility sessions — and execute trades, freeing up the rest of the day.

    ✅ Reduced Overnight Risk

    Because you close your trades within an hour, you avoid surprises from after-hours news or sudden gaps that can occur when the market is closed.

    ✅ Multiple Opportunities

    The 1-hour chart often presents several setups throughout the day. If you miss one, another may appear soon.

    ✅ Clearer Focus

    Working within one timeframe helps you develop a deeper feel for its patterns and market rhythm, improving your ability to spot valid setups.

    ✅ Lower Stress

    Shorter holding periods mean less emotional baggage and second-guessing. You stick to your plan, execute, and move on.


    Core Components of a Successful 1-Hour Swing Strategy

    To use this method well, you’ll want to build your plan around four essentials:


    1️⃣ Technical Analysis

    A solid understanding of chart patterns and indicators is key. Popular tools for the 1-hour timeframe include:

    • Moving Averages: Simple 5, 10, or 20-period MAs help define short-term trends.
    • RSI (Relative Strength Index): Shows when a market might be overbought or oversold.
    • Bollinger Bands: Highlight volatility and possible reversal points.

    2️⃣ Price Action Patterns

    Reading candlestick formations can give early signals of potential reversals or trend continuations. Common ones include:

    • Engulfing patterns
    • Pin bars
    • Doji candles

    Combine these with other tools for stronger confirmation.


    3️⃣ Support and Resistance Levels

    Always mark important zones where price has previously bounced or stalled. They guide:

    • Entry points
    • Stop-loss placement
    • Profit targets

    4️⃣ Risk Management

    This is non-negotiable for swing trading. Good habits include:

    • Risking only 1–2% of your capital per trade.
    • Using stop-loss orders to cap potential losses.
    • Aiming for at least a 1:2 risk-reward ratio.

    Popular 1-Hour Swing Trading Setups

    Here are some practical ideas you can adapt and test in a demo account before going live.


    📈 Support and Resistance Breakout

    • Identify: Mark clear support/resistance on the 1-hour chart.
    • Entry: Go long when price breaks and closes above resistance (or short when it breaks below support).
    • Stop-loss: A few pips beyond the breakout level.
    • Take-profit: The next key level or use a trailing stop.

    📉 Double Top/Bottom Reversal

    • Identify: Look for classic double tops (sell) or double bottoms (buy).
    • Entry: Enter after price breaks the neckline of the pattern.
    • Confirmation: A retest of the neckline can be a high-probability entry.
    • Stop-loss: Just beyond the pattern’s peak or trough.
    • Target: The projected move is usually equal to the height of the pattern.

    🔒 Inside Bar Breakout

    • Identify: An inside bar is a candle that fits entirely within the previous candle’s range.
    • Entry: Enter when price breaks above/below the mother bar.
    • Stop-loss: Opposite side of the mother bar.
    • Target: Next support/resistance or use a 1:2 risk-reward ratio.

    🔄 Swing High/Low Failure

    • Identify: Spot when price fails to make a new high in an uptrend or a new low in a downtrend.
    • Entry: Enter on a break below the last swing low (sell) or above the last swing high (buy).
    • Stop-loss: Beyond the recent swing.
    • Take-profit: Next major level or trail your stop in a strong trend.

    How to Execute a 1-Hour Swing Trade: Step-by-Step

    1️⃣ Pick Liquid Pairs: Major forex pairs like EUR/USD or GBP/USD usually work well.

    2️⃣ Mark Key Levels: Do your prep work before the hour begins. Identify support/resistance and trends.

    3️⃣ Watch for News: Use an economic calendar to avoid big surprise moves — unless you’re specifically trading news.

    4️⃣ Set Triggers: Wait for clear confirmation like breakouts, retests, or candlestick patterns.

    5️⃣ Manage Position Size: Calculate lots based on your risk per trade.

    6️⃣ Use Stops and Targets: Always place a stop-loss and know your take-profit level.

    7️⃣ Stick to Your Plan: No revenge trading or impulse trades. One or two quality setups are better than five random ones.

    8️⃣ Review Trades: Keep a trading journal. Note what worked, what didn’t, and what you’ll improve.


    Common Pitfalls to Avoid

    ❌ Overtrading: One good trade is better than ten forced ones.

    ❌ Ignoring Risk: Never skip stop-losses — they protect you from the unexpected.

    ❌ Emotional Decisions: Let your plan and data guide you, not fear or greed.


    Final Thoughts

    The 1-hour swing trading strategy can be a powerful way to tap into short-term moves without being glued to your screen all day. Like any method, it takes practice, patience, and discipline.

    Focus on learning to read price action, stick to your risk management rules, and keep your approach simple. Mastering this style might just help you find a sweet spot between active trading and work-life balance.


    Tip: Always start with a demo account if you’re new. Practice until your strategy feels second nature — then go live with confidence.

    Happy trading! 🚀📊

  • Forex vs. Cryptocurrency Trading: Which One Is Right for You?

    Forex vs. Cryptocurrency Trading: Which One Is Right for You?

    Trading in financial markets has become more accessible than ever, and two of the most popular options are Forex and cryptocurrency. They may look similar at first glance — both involve buying and selling currencies — but they’re actually very different when you look closer.

    This guide will help you understand how each market works, their key risks, and which one might suit your goals best.


    Understanding Forex Trading

    Forex, short for foreign exchange, is the global market for trading national currencies. It’s the largest and most liquid market in the world, moving over $6 trillion every single day.
    Forex trading is open 24 hours a day, five days a week. This means you can trade almost anytime during the workweek, across different time zones.

    When you trade Forex, you’re always trading currency pairs — for example, the euro against the US dollar (EUR/USD). Traders aim to profit by predicting how one currency’s value will move compared to another.

    The Forex market is heavily regulated in most countries, and you’ll find clear rules and oversight to protect traders.


    Understanding Cryptocurrency Trading

    Cryptocurrency trading, on the other hand, is all about digital assets like Bitcoin, Ethereum, and thousands of other coins. Unlike Forex, crypto runs on blockchain technology — decentralized and open all day, every day, with no closing hours.

    Crypto trading can be more volatile than Forex. It’s common to see massive price swings in a single day. Many traders love this because it means more chances to profit — but it also means bigger risks.

    The crypto market is less regulated than Forex in most parts of the world, which gives traders freedom but can also expose them to scams or hacks if they’re not careful.


    How These Markets Operate

    Market Hours:

    • Forex operates 24 hours a day, 5 days a week.
    • Crypto never sleeps — you can trade 24/7, even on weekends and holidays.

    Liquidity:

    • Major Forex pairs like EUR/USD have deep liquidity, so it’s easy to enter and exit trades.
    • Cryptocurrencies like Bitcoin and Ethereum are very liquid, but smaller coins may have less volume.

    Regulation:

    • Forex is usually well-regulated, with brokers licensed by financial authorities.
    • Crypto regulation depends on your country — some governments have strict rules, others have few.

    How Do Traders Analyze Each Market?

    Both Forex and crypto traders rely on two main types of analysis:

    Technical Analysis:
    Studying charts, price patterns, and indicators to forecast price movements.

    Fundamental Analysis:

    • In Forex, traders watch economic data, central bank decisions, interest rates, and political news.
    • In crypto, traders look at blockchain upgrades, technology adoption, regulations, and community sentiment.

    Trading Strategies

    People use many strategies for both markets, but some are more common in one than the other.

    • Day Trading: Opening and closing trades within a single day is popular for both Forex and crypto.
    • Swing Trading: Holding positions for days or weeks to catch bigger market moves.
    • Scalping: Making lots of small trades to capture tiny price changes — common in Forex because of its liquidity.
    • HODLing: Popular in crypto — buying and holding coins for the long term, ignoring short-term price swings.

    Main Risks to Consider

    Forex Risks:

    • Leverage can magnify gains but also amplify losses.
    • Major economic or political events can cause sudden changes in currency prices.
    • Traders can get caught overtrading, chasing every move and losing discipline.

    Crypto Risks:

    • Huge price volatility — coins can rise or fall dramatically within hours.
    • Hacks and security breaches are still concerns on some exchanges.
    • New regulations or bans can shake the market overnight.

    How Much Do You Need to Get Started?

    Forex brokers often let you open accounts with a small deposit and use leverage to control larger positions — but this comes with extra risk.

    Crypto is easy to start with too — many exchanges let you buy fractions of coins, so you don’t need a large upfront investment.


    Tools and Platforms

    Forex traders often use platforms like MetaTrader 4 or 5, packed with technical indicators and economic calendars.

    Crypto traders use exchanges like Binance, Coinbase, or Kraken. Many also follow community forums and news sites to stay up to date.


    Is Crypto Easier Than Forex for Beginners?

    It depends on your goals and risk tolerance.

    Crypto is attractive because it’s open 24/7, and you can start small. But its wild price swings can be stressful if you’re not ready for high risk.

    Forex might feel more predictable and stable if you enjoy following global economic news and prefer a market with clearer regulations.


    Tips for Choosing the Right Market

    ✅ Pick Forex if you want:

    • A well-established market with strict oversight.
    • More stable price movements.
    • To learn how currencies react to global events and data.

    ✅ Pick Crypto if you want:

    • High potential returns from high volatility.
    • A market that’s always open, including weekends.
    • To invest in innovative blockchain projects.

    Final Thoughts

    Both Forex and crypto offer exciting ways to trade, but each comes with its own risks and rewards. Take time to learn, practice with a demo account if you can, and never risk money you can’t afford to lose.

    Understand how each market works, keep your emotions in check, and always trade with a plan.

    Good luck, and trade smart! 🚀

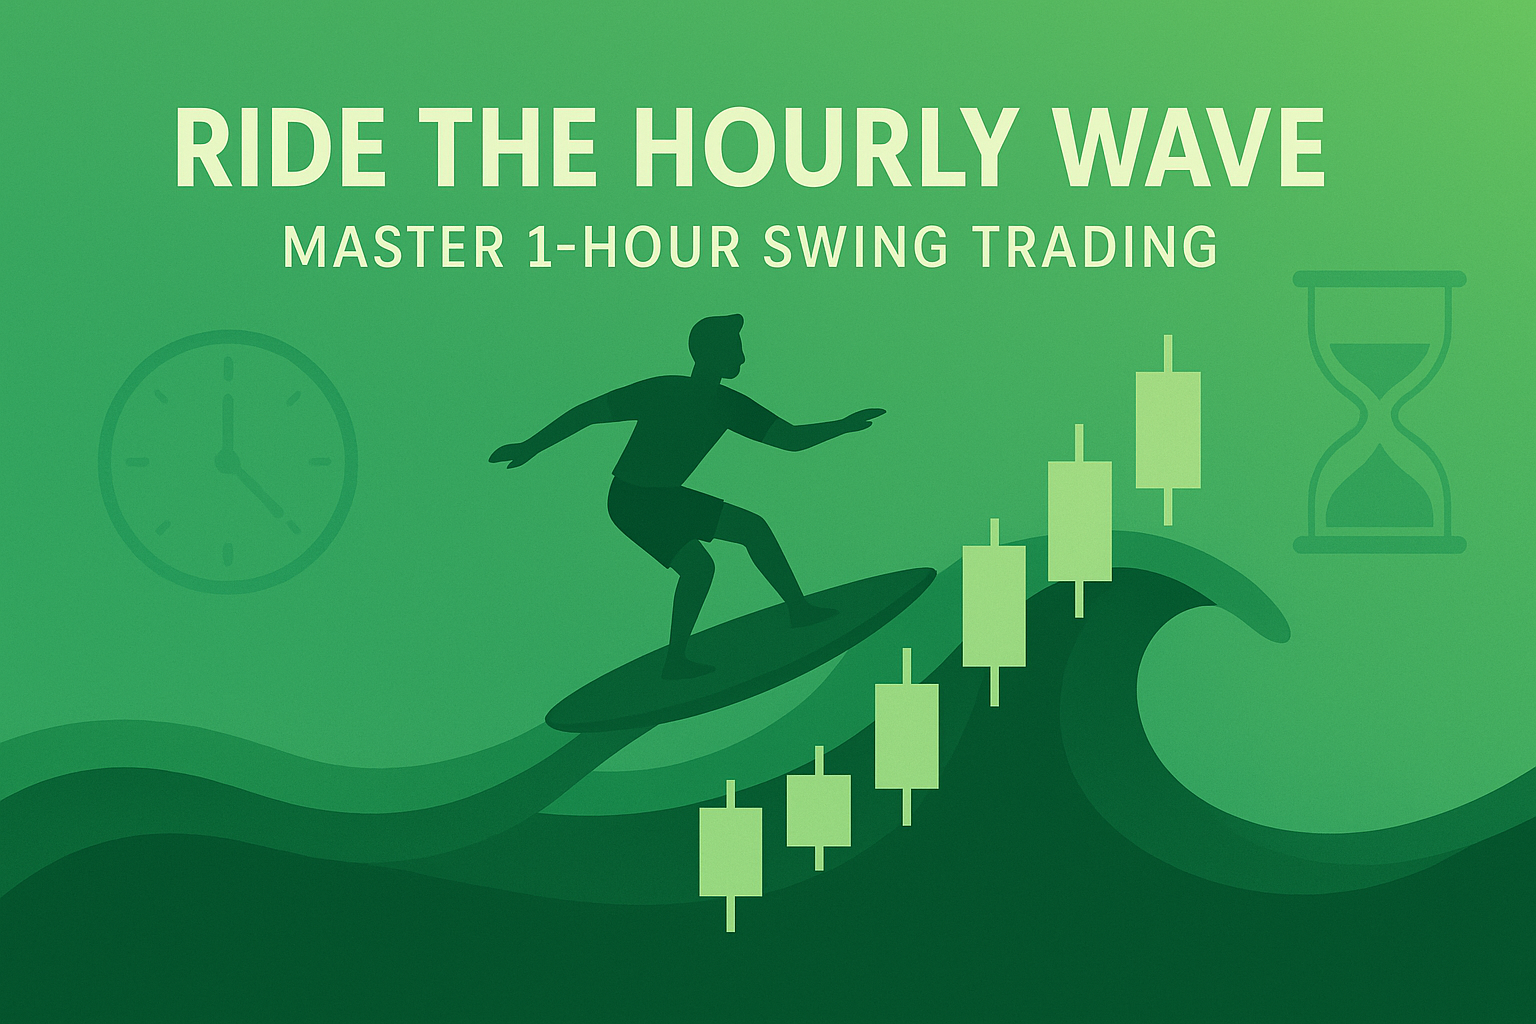
  • Ride the Hourly Wave: A Bigger Better Guide to 1-Hour Swing Trading

    Ride the Hourly Wave: A Bigger Better Guide to 1-Hour Swing Trading

    Quick Recap—Why the 1-Hour Chart Rocks

    1. Volatility that matters, noise that doesn’t.
    2. No “sleeping-with-positions” anxiety.
    3. One focused session → real work-life balance.

    (Need the full starter guide? Peek the previous reply; this edition builds on it.)

    ⚡ NEW: A Real-World “One-Hour” Walk-Through

    Because a story beats ten bullet points.

    Instrument: EUR/USD
    Date: Recent Tuesday, London session
    Backdrop: Price bouncing inside a 40-pip box for three hours.

    MinuteWhat HappenedTrader’s Move
    09:00Breakout candle closes 6 pips above resistance with higher tick volume.Enter long at close; stop 12 pips below breakout.
    09:20Price pulls back, taps the old resistance (now support).Hold—plan says “no panic before –1 R.”
    09:35Bullish pin-bar off support.Confidence boost; leave trade alone.
    10:00Price reaches 24 pips (2 R).Trail stop to breakeven +2; let it ride.
    10:15Spike to 33 pips, then stalls.Scale out half; trail the rest one candle back.
    10:45Price dips, tags trailing stop at +28 pips.Exit. Net +2.5 R in 105 minutes. Coffee earned.

    Takeaways

    • Level + volume confluence = quality breakout.
    • A partial exit locks joy in early without killing upside.
    • Written rules beat sweaty palms every time.

    Your Hour-Long Arsenal (expanded)

    1. Maps, not mysteries.
      • 10 & 21 EMA: dynamic support/resistance.
      • RSI(14): crowd exhaustion alarm.
      • ATR(14): size stops by recent volatility, not guesswork.
    2. Price-action goggles.
      • Engulfing candle at a level? Green light.
      • Inside bar? The spring’s coiling—plan the pounce.
    3. Walls & floors.
      • Horizontal S/R from the 4-H chart still matters on the 1-H—plot them.
    4. Risk brakes.
      • < 1 % per idea.
      • 2× reward or it’s not worth the trouble.
      • Stop = hard number, never “mental.”

    Five Go-To Playbooks (micro-refresher)

    1. Door-Breaker – pure breakout.
    2. Twin Peaks – double top/bottom reversal.
    3. Inside Pop – inside-bar squeeze.
    4. Swing-Fail Flip – trend rolls over.
    5. Three-Push Exhaustion – worn-out trend snaps back.

    (Scroll up to the original reply for the nitty-gritty rules.)

    🛠️ Trader’s Toolkit Sidebar

    Free (or dirt-cheap) helpers you’ll thank yourself for later.

    ToolWhy It RocksURL to Google
    MyFxBook Position Size CalculatorCalculates lot size in two clicks.“myfxbook position size”
    ForexFactory CalendarFilter news by currency, impact, and time.“forexfactory calendar”
    TradingView WatchlistsMulti-broker charts + alarms.“tradingview”
    Edgewonk (freemium)Journal + analytics without spreadsheets.“edgewonk journal”

    FAQ Blitz (snippet-friendly!)

    Q1. Can I run this on crypto or indices?
    Yes. Crypto’s 24/7 grind and indices’ opening bursts both play nice with a one-hour lens—just widen stops because ATR is bigger.

    Q2. I have a 9-to-5. When’s the best one-hour window?
    Pick a major session overlap—London–New York (13:00–16:00 UTC) often packs the juiciest range in the fewest candles.

    Q3. What account size should I start with?
    Any amount that lets you risk 1 % and still cover spreads. Micro-lot brokers mean even a $1 k account is workable; $5 k+ feels smoother.

    Q4. How many trades per day is “healthy”?
    Two quality setups beat six FOMO clicks. Let your trade journal win the argument—not Twitter.

    Q5. Does adding MACD / Stoch / Ichimoku help?
    Only if you can clearly explain what edge they add. When in doubt, subtract lines until you actually see price.

    Glossary Pop-Outs (for humans and Google)

    • ATR (Average True Range): Volatility yardstick; higher ATR = bigger safety-nets for stops.
    • Inside Bar: Candle that fits entirely inside the previous candle’s range—a visual pause.
    • R-Multiple: Profit or loss expressed as a multiple of risk (stop size). +2 R means twice what you risked.
    • EMA (Exponential Moving Average): Moving average that hugs price tighter than a simple MA—great for trend context.
    • Tick Volume: In spot FX, the count of price changes; a decent proxy when real volume is secret.

    Printable (or Copy-Pastable) Hourly Trade Checklist

    1. Economic calendar checked?
    2. Major S/R zones marked?
    3. ATR noted (stop calculator ready)?
    4. Bias from 4-H chart clear?
    5. Setup matches playbook?
    6. Position size = ≤ 1 % risk?
    7. Entry trigger candle closed?
    8. Stop + target typed in platform?
    9. Screenshot taken?
    10. Alarm set for review time?
    11. No open coffee cups near keyboard?
    12. Breathe → click.

    (Stick it on your monitor—future-you will smile.)


    Mind-the-Snakes Recap

    Overtrading, indicator clutter, emotional tinkering, ignoring spreads—all still lurking. Re-read this heading every Monday.


    Final Wave (Encore Edition)

    Bulked up, but still punchy: you now hold a 1-hour swing-trading field manual with stories, FAQs, tools, a glossary, and a ready-made checklist. Treat each trade like a lab experiment, keep risk tiny, and remember: the market will still be here after lunch—so should your sanity.

    Catch you on the next candle. 🏄‍♂️